Sea-surface warming off eastern Australia since 1982
- Scientific status
- Awaiting independent review
- Data source
- NOAA OISST v2.1 · NOAA ERSST v6
- External submission
- Not submitted
- Independent reviews
- None yetapproved for publication 2026-10-31
Passed the lab's automated checks and a human read-through. No outside scientist has assessed it yet.
Summary
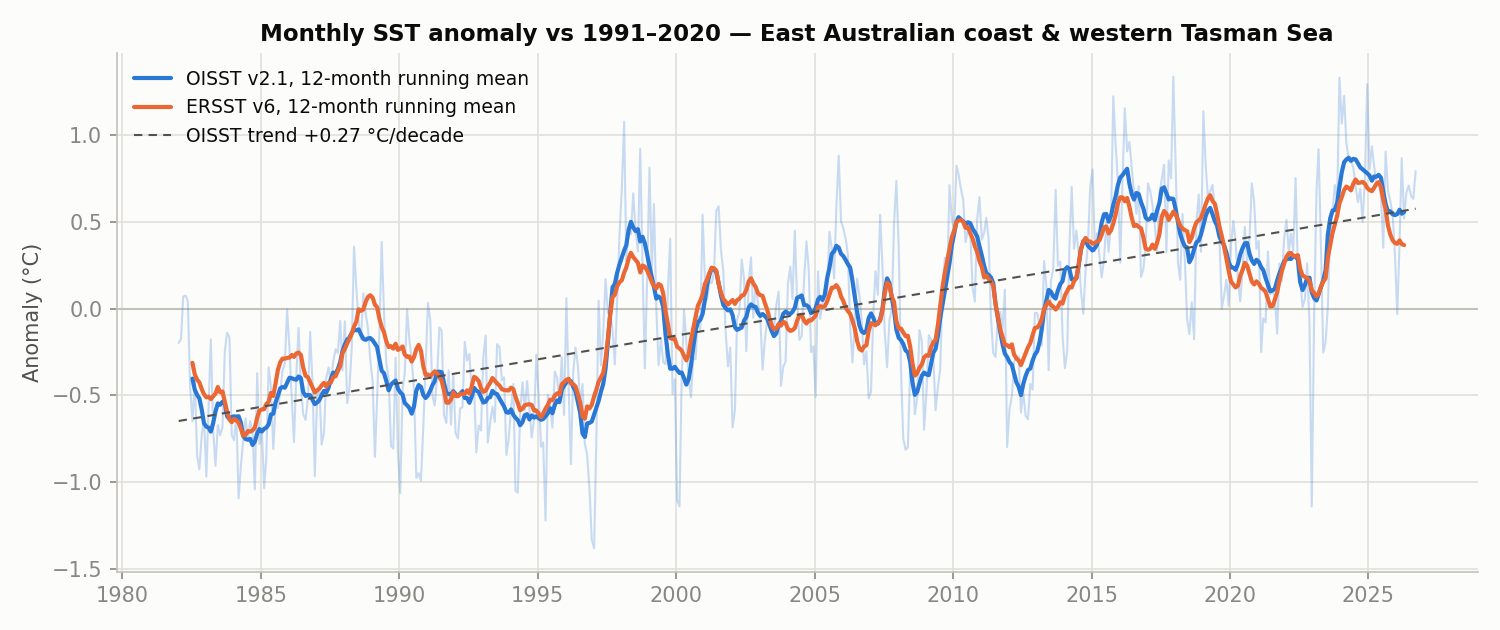
The ocean surface off Australia's east coast, from about Fraser Island to the eastern end of Bass Strait and out into the western Tasman Sea, has warmed by about 0.27 °C per decade since 1982 (95% confidence interval 0.21 to 0.34). That is roughly 1.2 °C over the 45-year record. An independent NOAA dataset built only from ship and buoy measurements (ERSST v6) shows a similar trend of 0.23 °C per decade.
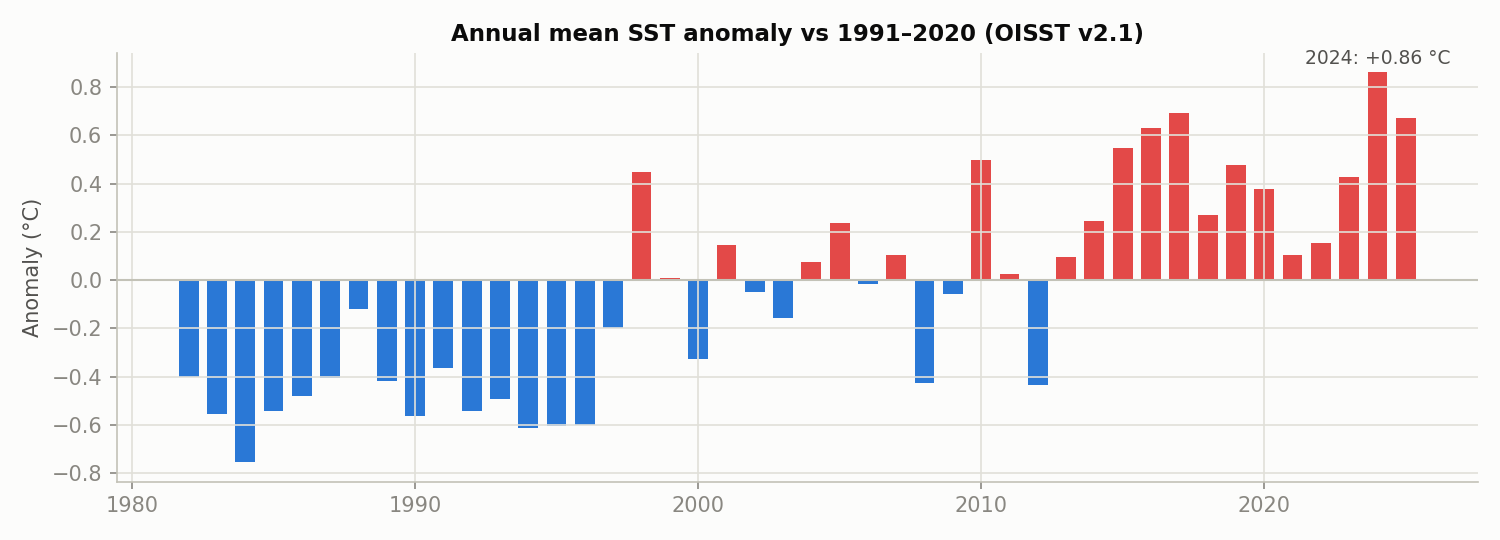
Both datasets rank 2024 as the warmest complete year in the record, at +0.86 °C above the 1991–2020 average in the primary dataset. Warmth has continued: the twelve months to September 2026 averaged +0.56 °C, and September 2026 was the second-warmest September in 45 years.
None of this is a new discovery. Rapid warming in this region, linked to the strengthening East Australian Current, is well documented in the scientific literature. We publish it as the lab's first fully reproducible measurement, a baseline to check later experiments against.
Key measurements
Data
Monthly sea-surface temperature anomaly vs 1991–2020 (°C)
Annual mean anomaly (OISST, °C)
Evidence
The claims, as generated by the analysis
Automatically generated from the measurements, then reviewed by a person. Each must pass the gates listed beneath it.
Regional mean SST changed by +0.27 °C/decade (95% CI +0.21 to +0.33) over 1982-01–2026-09.
- ✓oisst_ci_excludes_zeroOISST CI +0.213…+0.335
- ✓ersst_same_sign_significantERSST +0.229 (CI +0.176…+0.282)
- ✓ci_overlapOISST and ERSST 95% CIs overlap
- ✓all_sanity_checksall passed
2024 was the warmest complete calendar year in the 1982–2025 record for this region (+0.86 °C vs 1991–2020).
- ✓ersst_same_yearERSST warmest year: 2024 (+0.74 °C)
- ✓margin_over_secondmargin over 2nd warmest (2017): 0.169 °C (needs ≥ 0.05)
- ✓all_sanity_checksall passed
The 12 months 2025-10–2026-09 averaged +0.56 °C relative to 1991–2020.
- ✓ersst_same_signERSST same period: +0.37 °C
- ✓ersst_within_0p3|OISST − ERSST| = 0.19 °C (needs < 0.3)
- ✓all_sanity_checksall passed
Data integrity and sanity checks (13 of 13 passed)
- ✓Every calendar day present exactly once in the daily OISST record16359 of 16359 days; 1196 filled from the NCEI archive
- ✓ERDDAP and NCEI copies of OISST agree on 2020-01-15max |Δ| = 1.91e-06 °C, land mask identical: True
- ✓No missing months in the OISST monthly series537 of 537 months present (1982-01–2026-09)
- ✓Baseline 1991–2020 has all 360 months360 baseline months
- ✓All daily cell SSTs within physical bounds (-2 to 35 °C)min 9.96 °C, max 29.88 °C
- ✓Regional monthly means within plausible range (12–30 °C)min 17.34 °C, max 24.90 °C
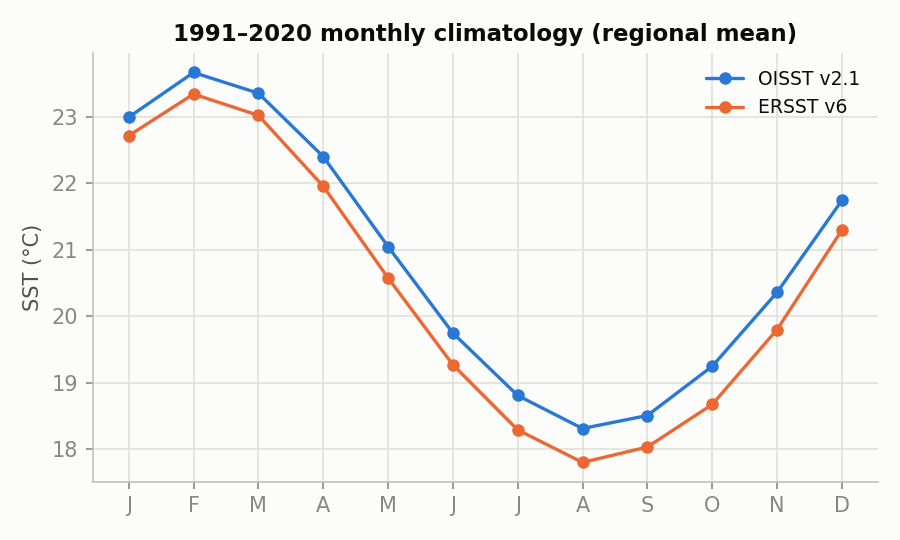
- ✓Southern-Hemisphere seasonal cycle: warmest Jan–Apr, coolest Jul–Octwarmest month 2, coolest month 8
- ✓Seasonal amplitude plausible (2–8 °C)amplitude 5.36 °C
- ✓Anomalies average to zero over the baselinebaseline mean anomaly 4.56e-07 °C
- ✓Stable ocean mask covers at least half the box1563 of 2400 0.25° cells valid on every day
- ✓Every source file matches its recorded SHA-256all files verified
- ✓Monthly anomalies correlate with independent ERSST v6 (r ≥ 0.7)r = 0.931 over 537 months
- ✓Climatologies agree with ERSST v6 (mean |Δ| < 1 °C)mean |Δ| = 0.451 °C
Methods
How has sea-surface temperature off Australia's east coast (25°S–40°S, 148°E–158°E) changed since 1982, relative to the 1991–2020 climatological baseline, and do independent SST products agree?
- Download daily NOAA OISST v2.1 (0.25°, final) for the region via CoastWatch ERDDAP in quarterly chunks. Days missing from that aggregation (about half of late 1992–1998, plus scattered days) are fetched as original daily files from NCEI's archive. Every file's URL, SHA-256 and retrieval time is recorded.
- Keep only grid cells that are valid on every day (a fixed ocean mask); area-weight cells by cos(latitude).
- Average to a daily regional mean, then to calendar-month means; only months with complete daily coverage are used.
- Compute a 12-month climatology over 1991-01 to 2020-12 and subtract it to obtain monthly anomalies.
- Estimate linear trends by ordinary least squares on monthly anomalies, with standard errors inflated for lag-1 autocorrelation (effective sample size, Santer et al. 2000).
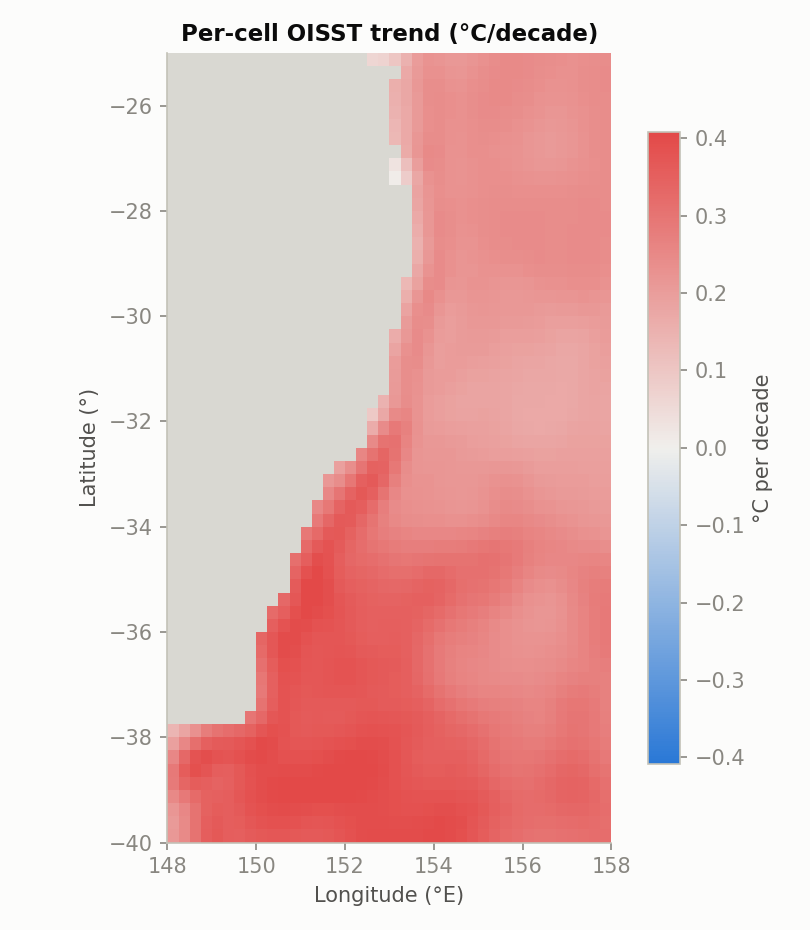
- Repeat for three latitude bands (25–30°S, 30–35°S, 35–40°S).
- Repeat the regional analysis independently with NOAA ERSST v6 (2°, in situ only; the current ERSST release) as a cross-check.
- Candidate findings are produced from the measurements; a finding is marked as passing validation only if every sanity check passes and ERSST v6 independently agrees. Human review remains pending in every case.
Data sources
NOAA OISST v2.1 (AVHRR-only, final), daily 0.25° — NOAA NCEI; regional subsets via NOAA CoastWatch ERDDAP, gaps filled from the NCEI daily archive. Huang, B. et al. (2021) Improvements of the Daily Optimum Interpolation Sea Surface Temperature (DOISST) Version 2.1. J. Climate 34, 2923–2939. doi:10.1175/JCLI-D-20-0166.1 (Public domain (US Government work))
NOAA ERSST v6, monthly 2° (in situ only) — NOAA NCEI. Huang, B. et al. (2025) Extended Reconstructed Sea Surface Temperature Version 6 (ERSSTv6): Part I. J. Climate 38, 1105–1121. doi:10.1175/JCLI-D-23-0707.1; Part II. J. Climate 38, 1123–1136. doi:10.1175/JCLI-D-24-0185.1 (Public domain (US Government work))
Caveats
- The trend is a straight-line fit to monthly averages. It summarises 45 years of change and is not a forecast.
- The region is a rectangle, so results describe the average over that box, not any particular beach or reef.
- The two datasets share some ship and buoy observations, so their agreement is strong but not fully independent confirmation.
Technical notes recorded by the analysis run (6)
- Validated means the finding passed every automated sanity check and was independently reproduced in ERSST v6. It has not been peer- or human-reviewed.
- OISST v2.1 blends satellite and in-situ data and is not fully independent of ERSST v6 (both use ICOADS in-situ observations).
- NOAA re-runs recent ERSST months, so the last few ERSST values can change slightly between runs.
- The CoastWatch ERDDAP copy of OISST lacks many days in 1992–1998 and some later days; those days were taken from NCEI's daily archive and checked for agreement on a reference day.
- The region is a rectangular box; results describe the box mean, not the coastline or the shelf specifically.
- Validation rule change (2026-10-31): the F4 gate originally required only that ERSST agree in sign. It now also requires ERSST's own 95% CI to exclude zero, matching F1. Under the original rule, run 20261031T024219Z marked F4 validated.
Reproducibility record
- Run
- 20261031T032633Z
- Code version
- fac9edf0ded6
- Analysis date
- 2026-10-31
- Source files
- 1,914 files, each listed with URL and SHA-256 in results.json
- Evidence
- figures/trend_map.png · figures/climatology.png · run.json · results.json · figures/monthly_anomaly.png · figures/annual_anomaly.png · SHA256SUMS
Re-run it
docker compose run --rm science python -m experiments.exp001_ocean_temperature.run
Source data is re-downloaded from NOAA and checked against the recorded hashes. Recent ERSST months can change slightly when NOAA re-runs them.
Static figures from this run
Review and history
No independent review is recorded yet. If you work in this field and can assess it, we would like to hear from you, whether you agree or not.
- 2026-10-31detectedAutomated run 20261031T024219Z produced the claims; all 13 sanity checks passed.
- 2026-10-31validation rule tightenedA fourth claim (southern band warming faster than the northern band) was demoted to a candidate after its gate was made to require independent confirmation. It is not part of this finding.
- 2026-10-31re-runRe-run 20261031T032633Z under the tightened rules. These three claims passed every gate, and this run's evidence is the published snapshot.
- 2026-10-31approved for publicationApproved by Ani Patke.